Road statistics provide food for thought
Traffic volumes on Great Britain’s roads have increased by over 50 billion vehicle miles a year – more than 16 per cent – since 2010[i]. Big changes are also being seen in the type of vehicles on our roads, with the number of light commercial vehicles growing at more than double the rate for cars.[ii]
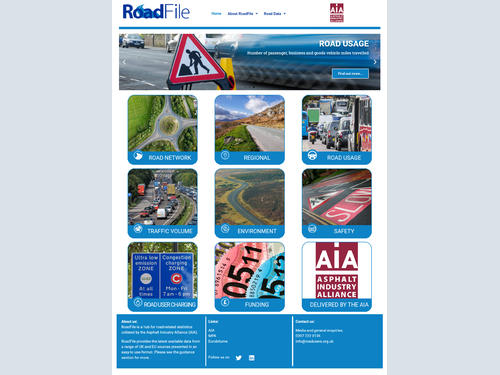
The data forms part of a comprehensive update of publicly available road-related statistics collated on RoadFile, an online hub delivered by the Asphalt Industry Alliance (AIA) using sources such as the Department for Transport (DfT) as well Eurostat for comparison with our near neighbours.
The GB data also indicates shifting patterns in the way in which the road network is used, with minor roads showing a more significant increase in traffic volumes than motorways and A roads.[iii]
“Reviewing the collated outputs and data sets alongside each other on RoadFile, gives those of us in the highways sector, a lot to think about,” said AIA Chair, Rick Green.
“For example, the growth in light licensed commercial vehicles and recorded increase in traffic volumes on local roads, may point towards the ‘Amazon effect’ – emphasising the increasing importance to our economy, even before the pandemic, of the ‘final mile’ for deliveries and the importance of our local roads in supporting the UK’s digital economy.
“And, when considering the higher growth in traffic volumes on minor roads, compared to motorway and A roads since 2010[iv], it also begs the question of why our vital local road networks still don’t receive their fair share of funding.[v] Afterall, it is generally accepted that local roads make up more than 97% of the total network in length.
“A good place for the Government to start would be making a five-year commitment to investing in local roads in the up-coming budget and the spending review to follow. This would allow local highway authorities to plan ahead and allow a more cost-effective whole-life approach to upgrades and maintenance.”
Updated statistics on RoadFile cover the period up to 2019 and are available at: www.roadusers.org.uk
[i] Traffic volumes (billion vehicle miles) across Britain increased 16.6% for the period 2010-2019 See:RoadFile/Road Network – Britain's total road traffic (billion vehicle miles). Roadfile/Traffic volume Increase in GB road traffic 2000-2019 (billion vehicle miles – https://www.roadusers.org.uk/?page_id=177
[ii] Between 2010-2019 the number of licensed cars grew by 12.2%, in comparison the growth in light and commercial vehicles was 28.5% for the same period. See: RoadFile/Regions – GB Licensed vehicles by region and type 2010-2019 (thousands) – https://www.roadusers.org.uk/?page_id=177
[iii] Traffic volumes on minor roads grew 25.3% between 2010 and 2019, in comparison with 11.8% on all major roads. See Roadfile/Traffic Volume – GB traffic by road class (billion vehicle miles). https://www.roadusers.org.uk/?page_id=274
[iv] As above – https://www.roadusers.org.uk/?page_id=274
[v] DfT figures report that annual public expenditure on national roads increased by more than 96% since 2012, whereas, for local roads, the increase was just 9.7%. See https://www.roadusers.org.uk/?page_id=403
The AIA’s Annual Local Authority Road Maintenance (ALARM) survey reported in 2020 that it would cost £11.14 billion and take eleven years to get local roads in England and Wales back into a steady state if adequate resources were in place. See: https://www.roadusers.org.uk/?page_id=403
